


本記事は、計測シリーズとして「^%SYS.MONLBL」を利用したデータ収集について解説します。
はじめに
^%SYS.MONLBL は、ObjectScript の処理を行単位で詳細に計測できるツールです。
ただし、実行時には多くの情報をサンプリングするため、システムに一定の負荷がかかり、処理速度が低下します。
そのため、本番環境で利用する際は影響範囲を十分に確認してください。
可能であれば検証環境での使用を推奨します。
計測開始
ターミナルを起動し、計測対象のネームスペースに切り替えます。
zn [計測対象のネームスペース]計測準備
以下のコマンドを実行します。
d ^%SYS.MONLBLコマンド実行後、警告メッセージが表示されます。
これは「パフォーマンスに影響が出る可能性がある」旨の注意喚起であり、通常は問題ありません。
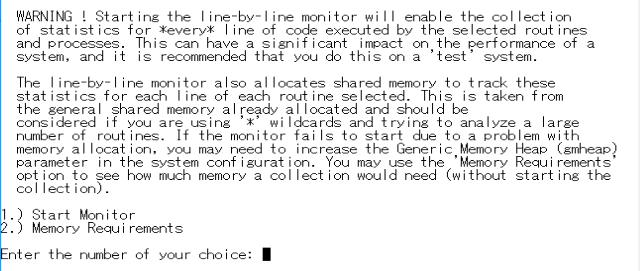
■計測開始
「1.) Start Monitor」を選択して計測を開始します。
1.) Start Monitor
2.) Memory Requirements

Enter the number of your choice: 1
■計測対象のクラス・ルーチンの選択
対象となるルーチンを指定します(複数ルーチンの入力が可能)。
ワイルドカード(*)の使用が可能です。
Enter the number of your choice: 1

Enter routine names to be monitored on a line by line basis.
Patterns using '*' are allowed.
Enter '?L' to see a list of routines already selected.
Press 'Enter' to terminate input.

Routine Name: developer.Sample.*         (2 routines added to selection.)
Routine Name:
※.intファイル単位で計測されるため、「.*」を付けるのが一般的です。
■メトリックの選択
今回は、「4) Monitor All Metrics」を選択します。
Select Metrics to monitor
  1) Monitor Minimal Metrics
  2) Monitor Lines (Coverage)
  3) Monitor Global Metrics
  4) Monitor All Metrics
  5) Customize Monitor Metrics

Enter the number of your choice: <1> 4
※各項目の選択を後程解説します。
■測定対象のプロセスを選択
今回は、全プロセスを対象とするため、「1) Monitor All Processes」を選択します。
Select Processes to monitor
  1) Monitor All Processes
  2) Monitor Current Process Only
  3) Enter list of PIDs

Enter the number of your choice: <1> 1
テスト環境では他のプロセスが動かない想定なので、「全プロセス」を選択しておいた方が簡単です。
■モニタ起動開始
Enterキーでモニタを開始します。
Monitor started.

Press RETURN to continue ...
■カウンタのクリア
念のため、開始直後にカウンタをリセットしたいため、「3.) Clear Counters」を選択します。
Line-by-Line Monitor

1.) Stop Monitor
2.) Pause Monitor
3.) Clear Counters
4.) Report - Detail
5.) Report - Summary
6.) Report - Delimited (CSV) Output
7.) Report - Procedure Level

Enter the number of your choice: 3
別ターミナルでコマンド実行
別ターミナル、または同一ターミナルで対象処理を実行します。
■サンプルPG
今回は下記処理を実行します。
ClassMethod lineTest()
{
s start = $zh
s (key, ID) = ""
, cnt = 0
f { s key = $o(^developer.data.Defrag1I("idxBirth", key)) q:key=""
f { s ID = $o(^developer.data.Defrag1I("idxBirth", key, ID)) q:ID=""
s cnt = cnt + 1
s data = ^developer.data.Defrag1D(ID)
s $lg(,,,,,,,,,,patientId,漢字氏名,,,,,性別,生年月日) = data
s 生年月日H = ..lineTestSub(生年月日)
s ^Sample.data(patientId)=$lb(漢字氏名,性別,生年月日H)
q:(cnt>100000)
}
}
s time = $zh - start
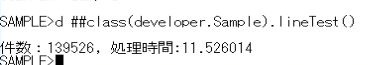
w !,$$$FormatText("件数:%1, 処理時間:%2", cnt, time)
}
ClassMethod lineTestSub(date As %String) As %Date
{
s dateH = $zdt(date, 3)
q dateH
}
実行します。
処理が完了したら、計測を終了しましょう。
計測終了とCSV出力
余計なデータ取得を防ぐため、まず一時停止してCSVファイルを出力します。
■一時停止
余計なデータ取得を防ぐため、まず一時停止します。
「2.) Pause Monitor」を選択します。
Line-by-Line Monitor

1.) Stop Monitor
2.) Pause Monitor
3.) Clear Counters
4.) Report - Detail
5.) Report - Summary
6.) Report - Delimited (CSV) Output
7.) Report - Procedure Level

Enter the number of your choice: 2
■結果の出力
計測結果をCSVで出力します。
「6.) Report – Delimited (CSV) Output」を選択します。
Line-by-Line Monitor

1.) Stop Monitor
2.) Resume Monitor
3.) Clear Counters
4.) Report - Detail
5.) Report - Summary
6.) Report - Delimited (CSV) Output
7.) Report - Procedure Level

Enter the number of your choice: 6
出力対象のクラス・ルーチンを選択します。
計測した全てのルーチンを対象とする場合は、「* or all」を選択してください。
特定のルーチンのみを出力する場合は、ルーチンの左にある番号を入力して下さい。
The following routines have been executed during the run,
and have detail statistics available for them.
1) developer.Sample.1

Enter list of routines, or * for all
Routine number (*=All)? *
出力先のディレクトリとファイル名を入力します。
The following routines have been executed during the run,
and have detail statistics available for them.
1) developer.Sample.1

Enter list of routines, or * for all
Routine number (*=All)? * - All
FileName: D:\Temp\csv\sample.csv
■戻る
CSVの出力が完了したら、Enterで戻ります。
Output written to D:\Temp\csv\sample.csv

Press RETURN to continue ...
■計測終了
計測を終了させるには、「1.) Stop Monitor」を選択します。
Line-by-Line Monitor

1.) Stop Monitor
2.) Resume Monitor
3.) Clear Counters
4.) Report - Detail
5.) Report - Summary
6.) Report - Delimited (CSV) Output
7.) Report - Procedure Level

Enter the number of your choice: 1
計測停止の意思を確認してくるので、「y」を入力します。
Stopping the line-by-line monitor will delete all of the data collected.
You should first save one or more of the Reports if you want to save the data.

Are you sure you want to stop the line-by-line monitor (y/n)? y■最初の画面に戻る
Enterをクリックして計測を修了します。
1.) Start Monitor
2.) Memory Requirements

Enter the number of your choice:
メトリックについて
出力されたファイルを確認します。
状況によって確認するメトリックは異なりますが、主に確認すべき項目は以下です。
| メトリック | 説明 |
|---|---|
| RtnLine | 行の実行回数 |
| Time | 該当行の実行時間 |
| TotalTime | 呼び出し先を含めた総時間 |
| GloRef | グローバル参照回数 |
| GloSet | グローバル更新回数 |
これらを確認することで、以下等を特定できます。
- ボトルネックとなっている処理
- 不要なループ
- 無駄なグローバルアクセス
■実際に出力したCSVの一部
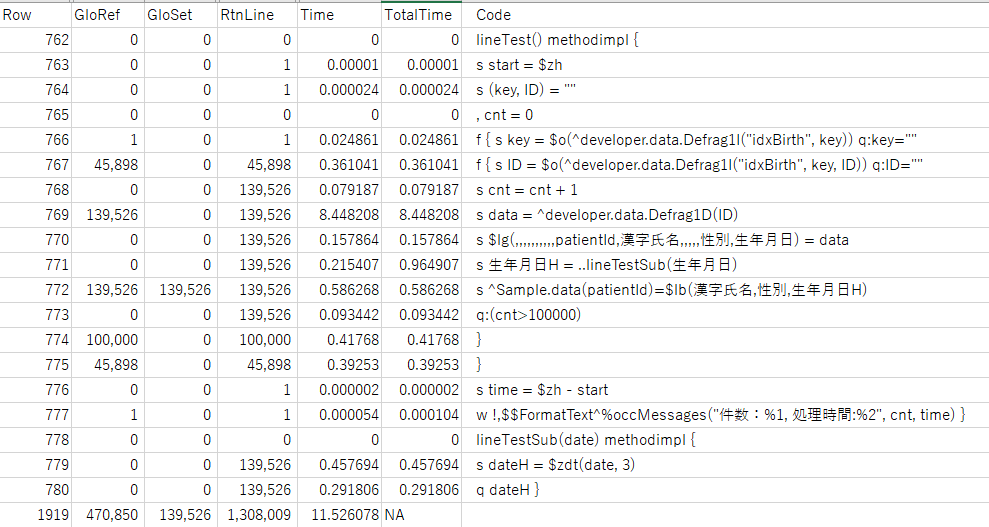
実行結果を確認すると、グローバルアクセスを行っている処理(Row=769)が、約14万回実行され、合計で約8.4秒を要していることが分かります。
1回あたりの処理時間はわずかですが、全体の処理時間が11.5秒であることを踏まえると、約73%をこの処理が占めていることになります。
この結果から、「ループ回数は適切か」「データ取得前に continue などで回避できないか」等々の改善案が考えられます。
このように、^%SYS.MONLBL を用いて処理を計測することで、各行の実行時間や無駄な処理を可視化でき、処理が適切かどうか、また改善が必要な場合の具体的な対策を検討しやすくなります。
メトリックの説明
各メトリックの説明と、「メトリック選択時」の各項目が対象としているメトリックの解説です。
メトリック選択時の項目
- Monitor Minimal Metrics
- Monitor Lines (Coverage)
- Monitor Global Metrics
- Monitor All Metrics
| 項目 | 説明 | Minimal | Lines | Global | All |
|---|---|---|---|---|---|
| Routine | ルーチン名 | 〇 | 〇 | 〇 | 〇 |
| Line | 実行行 | 〇 | 〇 | 〇 | 〇 |
| GloRef | グローバル参照 | 〇 | 〇 | ||
| GloSet | グローバル登録 | 〇 | 〇 | ||
| GloKill | グローバル削除 | 〇 | 〇 | ||
| DirBlkRd | ディレクトリブロック読取数 | 〇 | 〇 | ||
| UpntBlkRd | 上部ポインタブロック読取数 | 〇 | 〇 | ||
| BpntBlkRd | 下部ポインタブロック読取数 | 〇 | 〇 | ||
| DataBlkRd | データブロック読取数 | 〇 | 〇 | ||
| BdataBlkRd | ビックデータブロック読取数 | 〇 | 〇 | ||
| MapBlkRd | マップブロック読取数 | 〇 | 〇 | ||
| OthBlkRd | その他ブロック読取数 | 〇 | 〇 | ||
| DirBlkWt | ディレクトリブロック書込数 | 〇 | 〇 | ||
| UpntBlkWt | 上部ポインタブロック書込数 | 〇 | 〇 | ||
| BpntBlkWt | 下部ポインタブロック書込数 | 〇 | 〇 | ||
| DataBlkWt | データブロック書込数 | 〇 | 〇 | ||
| BdataBlkWt | ビックデータブロック書込数 | 〇 | 〇 | ||
| MapBlkWt | マップブロック書込数 | 〇 | 〇 | ||
| OthBlkWt | その他ブロック書込数 | 〇 | 〇 | ||
| DirBlkBuf | ディレクトリ(グローバルバッファ)読取数 | 〇 | 〇 | ||
| UpntBlkBuf | 上部ポインタ(グローバルバッファ)読取数 | 〇 | 〇 | ||
| BpntBlkBuf | 下部ポインタ(グローバルバッファ)読取数 | 〇 | 〇 | ||
| DataBlkBuf | データ(グローバルバッファ)読取数 | 〇 | 〇 | ||
| BdataBlkBuf | ビッグデータ(グローバルバッファ)読取数 | 〇 | 〇 | ||
| MapBlkBuf | マップ(グローバルバッファ)読取数 | 〇 | 〇 | ||
| OthBlkBuf | その他(グローバルバッファ)読取数 | 〇 | 〇 | ||
| JrnEntry | ジャーナル・エントリ | 〇 | 〇 | ||
| BlkAlloc | 割り当てられたブロック | 〇 | 〇 | ||
| BlockWait | グローバル・バッファへのアクセスを待機 | 〇 | 〇 | ||
| BlockWake | バッファ・リリースでアクティブにされた待機数 | 〇 | 〇 | ||
| RefNoGlo | 存在しないグローバルを検索 | 〇 | 〇 | ||
| KillNoData | 削除するものが見つからずにグローバル削除 | 〇 | 〇 | ||
| NetGloRef | ネットワーク・グローバル参照 | 〇 | |||
| NetGloSet | ネットワーク・グローバル登録 | 〇 | |||
| NetGloKill | ネットワーク・グローバル削除 | 〇 | |||
| NetReqSent | 送信されたネットワーク要求 | 〇 | |||
| NCacheHit | ネットワーク・キャッシュ・ヒット | 〇 | |||
| NCacheMiss | ネットワーク・キャッシュ・ミス | 〇 | |||
| NetLock | ネットワーク・ロック | 〇 | |||
| RtnLine | ObjectScript の行 | 〇 | 〇 | 〇 | |
| RtnLoad | ルーチンのロード | 〇 | 〇 | ||
| RtnFetch | ルーチンの取得 | 〇 | 〇 | ||
| LockCom | ロック・コマンド | 〇 | |||
| LockSucc | 成功したロック・コマンド | 〇 | |||
| LockFail | 失敗したロック・コマンド | 〇 | |||
| LockName | 名前レベルのロック | 〇 | |||
| TermRead | ターミナルの読み取り | 〇 | |||
| TermWrite | ターミナルの書き込み | 〇 | |||
| TermChRd | ターミナル読み取り文字数 | 〇 | |||
| TermChWrt | ターミナル書き込み文字数 | 〇 | |||
| SeqRead | シーケンシャル・リード | 〇 | |||
| SeqWrt | シーケンシャル・ライト | 〇 | |||
| MemAlloc | メモリが割り当てられた回数 | 〇 | |||
| MemFree | メモリが解放された回数 | 〇 | |||
| IJCMsgRd | 読み取ったローカル・インタジョブ・コミュニケーション (IJC) メッセージ | 〇 | |||
| IJCMsgWt | 書き込まれたローカル IJC メッセージ | 〇 | |||
| IJCNetMsg | 書き込まれたネットワーク IJC メッセージ | 〇 | |||
| BuffSent | 送信されたネットワーク・バッフ | 〇 | |||
| Time | 実行時間 | 〇 | 〇 | 〇 | |
| TotalTime | 呼び出し先も含んだ実行時間 | 〇 | 〇 | 〇 | |
| Code | コード | 〇 | 〇 | 〇 | 〇 |
おわりに
本記事では、^%SYS.MONLBL を用いた行単位の処理計測について解説しました。
処理のどこに時間がかかっているのかを可視化することで、ボトルネックの特定や無駄な処理の洗い出しが容易になります。
パフォーマンス改善は一度で終わるものではなく、継続的な計測と分析が重要です。
本ツールを活用し、より効率的なアプリケーションの開発・運用にお役立てください。